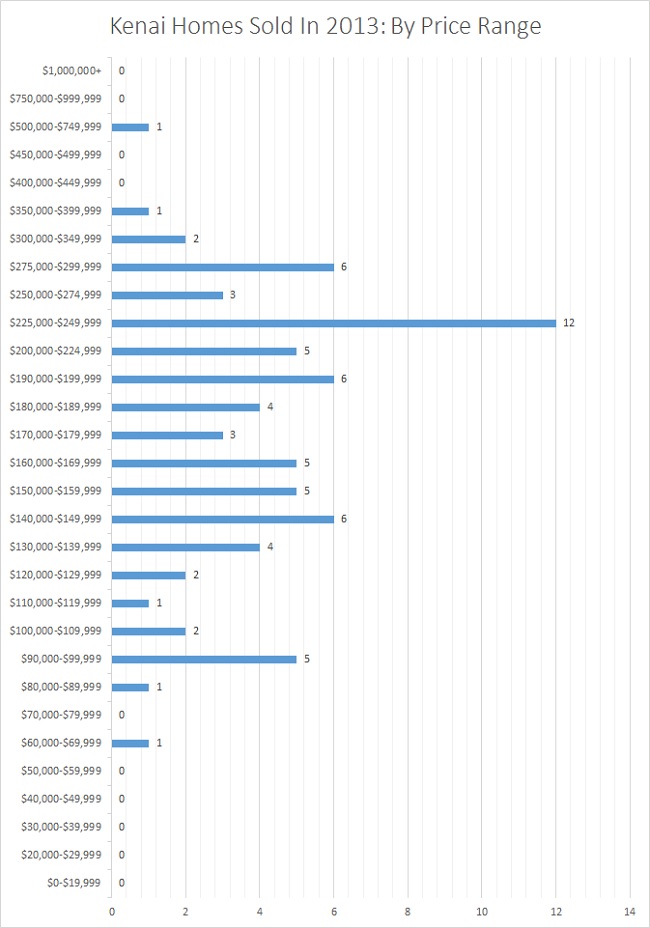
75 homes sold in Kenai real estate market in 2013.
- The average home price was $195,015.
- The highest Kenai home sale was $610,000.
- The median price was $187,500.
- The lowest price was $60,000.
- The average Market Time was 79.
907-252-2743
75 homes sold in Kenai real estate market in 2013.
The real estate market in Kenai continues to be strong with a six percent increase in sales year to date. Surprisingly the sales growth is down from mid year tally of a 28% increase. Kenai was rocking in the first half of 2013. The future looks bright with a ten percent growth in the number of pending sales from last November.
This market report and real estate statistics are for the city of Kenai and its MLS area for the time period of January 1st to November 21st 2012 to 2013. This information is considered accurate but is not guaranteed and is subject to change.
2012 238 Listings
2013 273 Listings
The Kenai housing inventory increased by 15% this year. The driving force is the continued housing recovery and major shifts in the local oil and gas industry.
2012 212 New Listings
2013 265 New Listings
The number of new Kenai homes for sale increased by 25% in 2013. A large portion of the new listings were related to the bulk of employee transfers into and out of the area by Marathon and Hillcorp after the sale of the Cook Inlet Oil and Gas rights.
2012 98 pending listings
2013 108 pending listings
Pending Sales in Kenai follow the trend in inventory and new listing growth.
2012 100 sold homes
2013 106 sold homes
Although the inventory increased by 25%, the number of homes sold has only increase by six percent in Kenai.
2012 $160,583
2013 $181,535
The average sales price for Kenai has increased by thirteen percent.A healthy increase driven by record low interest rates and a strong local economy.
2012 97% of list price
2013 95% of list price
The percent of a home’s sales price to it’s list price dropped by two percent this year from 97% in 2012 to 95% in 2013. Given the large increase in the average sales price, this drop is likely caused by aggressive speculation of sellers in setting their list price and the ability of the buyers to demand a more realistic value.
2012 days on market 171
2012 days on market 105
A healthy market turns over it’s housing inventory quickly and the average time it took to sell a home dropped by 66 days in 2013.
2013 is a good year to sell your home and not a bad year to buy either. Interest rate are still historically low and the inventory of homes to choose from has grown. I will add not to wait around. Homes are selling faster than in the past if they are priced appropriately. The second half of 2013 may be a different story as interest rates climb and the inventory continues to shrink.
If you would like to learn more about buying or selling your home contact Glenda Feeken at RE/MAX today. 907 252 2743.
Kenai Real Estate has had an active year with a 30% jump in the number of closed home sales. That means there are fifty three happy new homeowners in Kenai. The good news continues as 2013 is set to close with a bang. Kenai homes under contract are near historic highs with 57 pending deals. That is a 14% increase over this time last year and greater than the total number of Kenai properties sold to date.
Kenai # Sold # Pending Average Sales Price % of Sales to List Price
2013 53 57 $209,592 96%
2012 40 50 $203,379 98%
*data for a time period from January 1st to August 13th for 2012 and 2013.
Not all news is good news for Kenai home sales. The big story is the drop in the average sales price from $209,592 to $203,379, a three percent drop from last year. The list to sales price also dropped from 98% to 96%, a two percent drop. The buyers have been active but have been unforgiving to homes priced outside of the market, or just plan overpriced.
What is different about our market today?
There has been a surge in demand for houses nationally and locally given the upswing in the general economy. What has changed from the good old days is the memory of the real estate bubble collapse. Buyers are working hard to make prudent real estate investments. Buyers are also clinging to an expectation of low recession prices. This means that properties that are overpriced or have functionally obsolescent features are struggling to compete.
What does functionally obsolescent features mean? It is the catch phrase your appraiser uses to justify a devaluation of your property compared to it’s peers. A good example would be when your home does not having a master bathroom and walk in closet, but all of the comparable sales within your neighborhood do. The appraiser will discount your home’s value for the lack of a desirable, useful and valuable feature.
The take away is to be sure that your home is priced similarly to the homes that have already sold in your area. It is the measure that everyone is looking at to judge value, particularly your potential buyer and their agent.
 This market snapshot was prepared for real estate and homes for sale in Kenai, Soldotna, North Kenai, Ridgeway, K-Beach, Sterling, Funny River, Kasilof and South of Soldotna.
How’s the market? The Kenai and Soldotna real estate market are on a upswing with nine home sales, no investment properties sale and three land sales. The inventory of existing homes has surged with thirty new single family home listings over the last week. Almost half were in Soldotna with the remaining half split bewteen Kenai and Kasilof. The inventory of homes for sale continues to grow with an average of 398 homes listed in the area. If you would like to be notified about new listings in your area check out our email listings alerts.
Homes For Sale: last week 375, this week 398
Number Of New Home Listing: last week 14, this week 30
Number Pending: last week 10, this week 7
Number Sold: last week 7, this week 9
Days On Market For Sold: last week 70, this week 129 days
Days On Market For Active: last week 218, this week 211 days
List Vs. Sales Price Ratio: last week 96.25%, this week 94.47%
Investment Property For Sale: last week 86, this week 88
Number Of New Investment Listings: last week 3, this week 2
Number Pending: last week 2, this week 0
Number Sold: last week 1, this week 0
Days On Market For Sold: last week 28 days, this week N/A days
Days On Market For Active: last week 313 days, this week 312 days
List Vs. Sales Price Ratio: last week 100%, this week N/A
Land For Sale: last week 918, this week 926
Number Of New Land Listings: last week 9, this week 7
Number Pending: last week 4, this week 1
Number Sold: last week 1, this week 3
Average Days On Market For Sold: last week 198 days, this week 197
Average Days On Market For Active: last week 585 days, this week 588
List Vs. Sales Price Ratio: last week 100%, this week 85.22%
Information is deemed to be reliable, but is not guaranteed.
Looking For More Information?
First Quarter 2013 Market Comparison: Kenai & Soldotna Area Real Estate Market Report
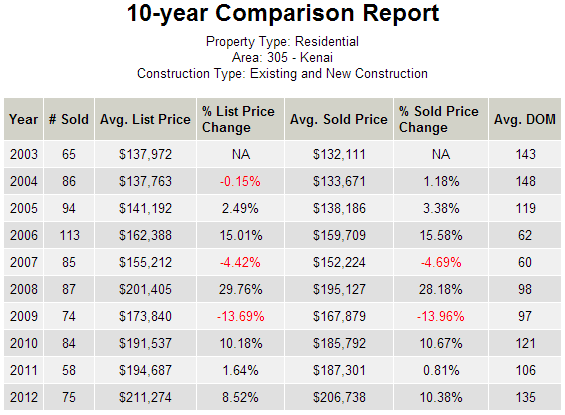
Central Kenai Peninsula Real Estate 2012 Market Report: Ten Year Comparison Report
FHA Loans More Expensive Than Expected For Kenai Home Buyers
The Overdue Reality Check For Kenai River Real Estate
This market report is for residential properties and homes for sale in North Kenai, Kenai, Kalifornsky Beach, Soldotna, Kasilof, Clam Gulch, Soldotna, Ridgeway, Sterling and Funny River. The time period is Jauary 1st through April 30th for 2012 and 2013.
| Area | Last Year | This Year | PCT |
| North Kenai | 99 | 84 | -15 |
| Kenai | 101 | 91 | -9 |
| Kalifornsky Beach | 114 | 101 | -11 |
| S of Soldotna | 30 | 22 | -26 |
| Kasilof | 47 | 52 | 10 |
| Clam Gulch | 4 | 4 | 0 |
| Soldotna | 57 | 62 | 8 |
| Ridgeway | 57 | 60 | 5 |
| Sterling | 86 | 97 | 12 |
| Funny River | 35 | 41 | 17 |
| Residential Totals: | 630 | 614 | -2 |
| Area | Last Year | This Year | PCT |
| North Kenai | 41 | 35 | -14 |
| Kenai | 53 | 54 | 1 |
| Kalifornsky Beach | 58 | 55 | -5 |
| S of Soldotna | 12 | 13 | 8 |
| Kasilof | 20 | 18 | -10 |
| Clam Gulch | 1 | 1 | 0 |
| Soldotna | 31 | 34 | 9 |
| Ridgeway | 22 | 32 | 45 |
| Sterling | 42 | 42 | 0 |
| Funny River | 10 | 19 | 90 |
| Residential Totals: | 290 | 303 | 4 |
| Area | Last Year | This Year | PCT |
| North Kenai | 14 | 10 | -28 |
| Kenai | 14 | 23 | 64 |
| Kalifornsky Beach | 24 | 15 | -37 |
| S of Soldotna | 2 | 4 | 100 |
| Kasilof | 2 | 9 | 350 |
| Clam Gulch | 1 | 1 | 0 |
| Soldotna | 9 | 17 | 88 |
| Ridgeway | 11 | 8 | -27 |
| Sterling | 8 | 22 | 175 |
| Funny River | 6 | 5 | -16 |
| Residential Totals: | 91 | 114 | 25 |
| Area | Last Year | This Year | PCT |
| North Kenai | 157,657 | 184,702 | 17 |
| Kenai | 176,521 | 215,600 | 22 |
| Kalifornsky Beach | 205,838 | 229,810 | 11 |
| S of Soldotna | 122,500 | 197,875 | 61 |
| Kasilof | 72,500 | 113,856 | 57 |
| Clam Gulch | 70,000 | 140,000 | 100 |
| Soldotna | 298,217 | 261,059 | -12 |
| Ridgeway | 280,591 | 208,835 | -25 |
| Sterling | 182,500 | 194,768 | 6 |
| Funny River | 324,333 | 130,380 | -59 |
| Residential Totals: | 211,594 | 203,988 | -3 |
All information is deemed reliable, but is not guaranteed. Interested parties are advised to independently verify all information contained herein. © 2013 MLS and FBS.
This market snapshot was prepared for real estate and homes for sale in Kenai, Soldotna, North Kenai, Ridgeway, K-Beach, Sterling, Funny River, Kasilof and South of Soldotna.
How’s the market? The Kenai and Soldotna real estate market cooled slight from the prior week with seven home sales, one investment properties sale and one land sale. The year is off to strong start and I will dive into more detail in another post about a comparison of the real estate market for the first four months in 2013 compared to 2012. The inventory of homes for sale continues to grow with fourteen new listings for an average of 375 homes listed in the area. If you would like to be notified about new listings in your area check out our email listings alerts.
Homes For Sale: last week 369, this week 375
Number Of New Home Listing: last week 15, this week 14
Number Pending: last week 11, this week 10
Number Sold: last week 8, this week 7
Days On Market For Sold: last week 83, this week70 days
Days On Market For Active: last week 219, this week 218 days
List Vs. Sales Price Ratio: last week 98.35%, this week 96.28%
Investment Property For Sale: last week 71, this week 86
Number Of New Investment Listings: last week 0, this week 3
Number Pending: last week 0, this week 2
Number Sold: last week 2, this week 1
Days On Market For Sold: last week 336 days, this week 28 days
Days On Market For Active: last week 375 days, this week 313 days
List Vs. Sales Price Ratio: last week 79.26%, this week 100%
Land For Sale: last week 914, this week 918
Number Of New Land Listings: last week 26, this week 9
Number Pending: last week 4, this week 4
Number Sold: last week 4, this week 1
Average Days On Market For Sold: last week 169 days, this week 198
Average Days On Market For Active: last week 580 days, this week 585
List Vs. Sales Price Ratio: last week 83.45%, this week 100%
Looking For More Information?
First Quarter 2013 Market Comparison: Kenai & Soldotna Area Real Estate Market Report
Central Kenai Peninsula Real Estate 2012 Market Report: Ten Year Comparison Report
FHA Loans More Expensive Than Expected For Kenai Home Buyers
The Overdue Reality Check For Kenai River Real Estate